Stop Hunt Indicator ║ BullVision 🧠 Overview
The Stop Hunt Indicator (SmartTrap Radar) is an original tool designed to identify potential liquidity traps caused by institutional stop hunts. It visually maps out historically significant levels where price has repeatedly reversed or rejected — and dynamically detects real-time sweep patterns based on volume, structure, and candle rejection behavior.
This script does not repurpose existing public indicators, nor does it use default TradingView built-ins such as RSI, MACD, or MAs. Its core logic is fully proprietary and was developed from scratch to support discretionary and data-driven traders in visualizing volatility risks and manipulation zones.
🔍 What the Indicator Does
This indicator identifies and visualizes potential stop hunt zones using:
Historical structure analysis: Swing highs/lows are identified via a configurable lookback period.
Liquidity level tracking: Once detected, levels are monitored for touches, age, and volume strength.
Proprietary scoring model: Each level receives a real-time significance score based on:
Age (how long the level has held)
Number of rejections (touches)
Relative volume strength
Proximity to current price
The glow intensity of plotted levels is dynamically mapped based on this score. Bright glow = higher institutional interest probability.
⚙️ Stop Hunt Detection Logic
A stop hunt is flagged when all of the following are met:
Price sweeps through a high/low beyond a user-defined penetration threshold
Wick rejection occurs (i.e., candle closes back inside the level)
Volume spikes above the average in a recent window
The script automatically:
Detects bullish stop hunts (below support) and bearish ones (above resistance)
Marks detected sweeps on-chart with optional 🔰/🚨 signals
Adjusts glow visuals based on score even after the sweep occurs
These sweeps often precede local reversals or high-volatility zones — this is not predictive, but rather a reactive mapping of market manipulation behavior.
📌 Why This Is Not Just Another Liquidity Tool
Unlike typical liquidity heatmaps or S/R indicators, this script includes:
A proprietary significance score instead of fixed rules
Multi-layer glow rendering to reflect level importance visually
Real-time scoring updates as new volume and touches occur
Combined volume × rejection × structure logic to validate stop hunts
Fully customizable detection logic (lookback, wick %, volume filters, max bars, etc.)
This indicator provides a specialized view focused solely on visualizing trap setups — not generic trend signals.
🧪 Usage Recommendations
To get started:
Add the indicator to your chart (volume-enabled instruments only)
Customize detection:
Lookback Period for structure
Penetration % for how far price must sweep
Volume Spike Multiplier
Wick rejection strength
Enable/disable features:
Glow effects
Hunt markers
Score labels
Volume highlights
Watch for:
🔰 Bullish Sweeps (below support)
🚨 Bearish Sweeps (above resistance)
Bright glowing zones = high-liquidity targets
This tool can be used for both confluence and risk assessment, especially around high-impact sessions, liquidation events, or range extremes.
📊 Volume Dependency Notice
⚠️ This indicator requires real volume data to function correctly. On instruments without volume (e.g., synthetic pairs), certain features like spike detection and scoring will be disabled or inaccurate.
🔐 Closed-Source Disclosure
This script is published as invite-only to protect its proprietary scoring, glow mapping, and detection logic. While the full implementation remains confidential, this description outlines all key mechanics and configurable logic for user transparency.
在脚本中搜索"relative volume"

Dr Avinash Talele momentum indicaterTrend and Volatility Metrics
EMA10, EMA20, EMA50:
Show the percentage distance of the current price from the 10, 20, and 50-period Exponential Moving Averages.
Positive values indicate the price is above the moving average (bullish momentum).
Negative values indicate the price is below the moving average (bearish or corrective phase).
Use: Helps traders spot if a stock is extended or pulling back to support.
RVol (Relative Volume):
Compares current volume to the 20-day average.
Positive values mean higher-than-average trading activity (potential institutional interest).
Negative values mean lower activity (less conviction).
Use: High RVol often precedes strong moves.
ADR (Average Daily Range):
Shows the average daily price movement as a percentage.
Use: Higher ADR = more volatility = more trading opportunities.
50D Avg. Vol & 50D Avg. Vol ₹:
The 50-day average volume (in millions) and value traded (in crores).
Use: Confirms liquidity and suitability for larger trades.
ROC (Rate of Change) Section
1W, 1M, 3M, 6M, 12M:
Show the percentage price change over the last 1 week, 1 month, 3 months, 6 months, and 12 months.
Positive values (green) = uptrend, Negative values (red) = downtrend.
Use: Quickly see if the stock is gaining or losing momentum over different timeframes.
Momentum Section
1M, 3M, 6M:
Show the percentage gain from the lowest price in the last 1, 3, and 6 months.
Use: Measures how much the stock has bounced from recent lows, helping find strong rebounds or new leaders.
52-Week High/Low Section
From 52WH / From 52WL:
Show how far the current price is from its 52-week high and low, as a percentage.
Closer to 52WH = strong uptrend; Closer to 52WL = possible value or turnaround setup.
Use: Helps traders identify stocks breaking out to new highs or rebounding off lows.
U/D Ratio
U/D Ratio:
The ratio of up-volume to down-volume over the last 50 days.
Above 1 = more buying volume (bullish), Below 1 = more selling volume (bearish).
Use: Confirms accumulation or distribution.
How This Table Helps Analysts and Traders
Instant Trend Assessment:
With EMA distances and ROC, analysts can instantly see if the stock is trending, consolidating, or reversing.
Momentum Confirmation:
ROC and Momentum sections highlight stocks with strong recent moves, ideal for momentum and breakout traders.
Liquidity and Volatility Check:
Volume and ADR ensure the stock is tradable and has enough price movement to justify a trade.
Relative Positioning:
52-week high/low stats show whether the stock is near breakout levels or potential reversal zones.
Volume Confirmation:
RVol and U/D ratio help confirm if moves are backed by real buying/selling interest.
Actionable Insights:
By combining these metrics, traders can filter for stocks with strong trends, robust momentum, and institutional backing—ideal for swing, position, or even intraday trading.

VWAP Adaptive (RelVol-Adjusted)This indicator provides an Adaptive VWAP that adjusts volume weighting using RelVol (Relative Volume at Time), offering a more accurate and context-aware price reference during sessions with irregular volume behavior.
Classic VWAP calculates the average price weighted by raw volume, without considering the time of day. This becomes a serious limitation during major market events such as CPI releases, FOMC announcements, NFP, or large-cap earnings. These events often trigger massive volume spikes within one or two candles. As a result, the classic VWAP gets pulled toward those extreme prices and becomes permanently skewed for the rest of the session.
In such conditions, classic VWAP becomes unreliable. It no longer reflects fair value and often misleads traders relying on it for dynamic support, resistance, or reversion signals.
This Adaptive VWAP improves on that by using RelVol, which compares the current volume to the average volume seen at the same time over previous sessions. It gives more weight to price when volume is typical for that moment, and adjusts the influence when volume is statistically abnormal. This reduces the impact of isolated volume spikes and stabilizes the VWAP path, even in high-volatility environments.
For example, on SPY 1-minute or 5-minute charts during a CPI release, a massive spike in volume and price can occur within a single candle. Classic VWAP will immediately anchor itself to that spike. Adaptive VWAP using RelVol softens that effect and maintains a more realistic trajectory.
Key features:
- Adaptive VWAP weighted by time-adjusted Relative Volume (RelVol)
- Designed to maintain VWAP reliability during macroeconomic events
- Flexible anchoring: Session, Week, Month, Quarter, Earnings, etc.
- Optional display of Classic VWAP for comparison
- Up to 3 customizable deviation bands (standard deviation or percentage)
This tool is ideal for intraday traders who need a VWAP that remains usable and unbiased, even in volatile sessions. It adds robustness to VWAP-based strategies by incorporating time-sensitive volume normalization.

OA - PowerZones Support And ResistancePowerZones - Dynamic Support/Resistance Identifier
Overview
PowerZones is an advanced technical analysis tool that automatically detects significant support and resistance zones using volume data and pivot points. This indicator pulls data from higher timeframes (weekly by default) to help you identify strong and meaningful levels that are filtered from short-term "noise."
Features
Multi-Timeframe Analysis: Create support/resistance levels from daily, weekly, or monthly data
Volume Filtering: Detect high-volume pivot points to identify more reliable levels
Dynamic Threshold: Volume filter that automatically adjusts to market conditions
Visual Clarity: Support/resistance zones are displayed as boxes with adjustable transparency
Optimal Level Selection: Filter out close levels to focus on the most significant support/resistance points
Use Cases
Entry/Exit Points: Identify trading opportunities at important support and resistance levels
Stop-Loss Placement: Use natural support levels to set more effective stop-losses
Target Setting: Use potential resistance levels as profit-taking targets
Understanding Market Structure: Detect long-term support/resistance zones to better interpret price movement
Input Parameters
Lookback Period: The period used to determine pivot points
Box Width : Adjusts the width of support/resistance zones
Relative Volume Period: The period used for relative volume calculation
Maximum Number of Boxes: Maximum number of support/resistance zones to display on the chart
Box Transparency: Transparency value for the boxes
Timeframe: Timeframe to use for support/resistance detection (Daily, Weekly, Monthly)
How It Works
PowerZones identifies pivot highs and lows in the selected timeframe. It filters these points using volume data to show only meaningful and strong levels. The indicator also consolidates nearby levels, allowing you to focus only on the most important zones on the chart.
Best Practices
Weekly timeframe setting is ideal for identifying long-term important support/resistance levels
Working with weekly levels on a daily chart allows you to combine long-term levels with short-term trades
ATR-based box width creates support/resistance zones that adapt to market volatility
Use the indicator along with other technical indicators such as RSI, MACD, or moving averages to confirm trading signals
Note: Like all technical indicators, this indicator does not guarantee 100% accuracy. Always apply risk management principles and use it in conjunction with other analysis methods to achieve the best results.
If you like the PowerZones indicator, please show your support by giving it a star and leaving a comment!

Rogue ORB PRORogue ORB Pro is a precision-engineered Opening Range Breakout (ORB) indicator built for active intraday traders who need real signals, not noise.
This tool identifies high-probability breakout entries from the opening range, enhanced with optional ATR-based stop loss levels, deviation targets, cooldown filters, and a relative volume gate to filter weak setups.
🔍 Key Features:
Opening Range High/Low: Drawn from a user-defined time window and locked for the day
Deviations: Automatically plots target zones above and below the OR range (e.g. 1, 2 deviations)
Pre-Market Levels: Automatically draws pre market high and low lines at the end of pre market session
Buy/Sell Signals: Triggered on breakout of the OR High/Low with configurable breakout logic (touch or close)
ATR Stop Loss Line: Dynamically drawn at a fixed ATR distance from breakout candle, with optional SL label
Cooldown Period: Prevents back-to-back signals by enforcing a user-defined bar delay between entries, can help with overtrading
Volume Filter: Optional relative volume filter that requires breakout candles to exceed a custom volume threshold
VWAP Overlay: Visual VWAP for directional bias and confluence

RVOL Effort Matrix💪🏻 RVOL Effort Matrix is a tiered volume framework that translates crowd participation into structure-aware visual zones. Rather than simply flagging spikes, it measures each bar’s volume as a ratio of its historical average and assigns to that effort dynamic tiers, creating a real-time map of conviction , exhaustion , and imbalance —before price even confirms.
⚖️ At its core, the tool builds a histogram of relative volume (RVOL). When enabled, a second layer overlays directional effort by estimating buy vs sell volume using candle body logic. If the candle closes higher, green (buy) volume dominates. If it closes lower, red (sell) volume leads. These components are stacked proportionally and inset beneath a colored cap line—a small but powerful layer that maintains visibility of the true effort tier even when split bars are active. The cap matches the original zone color, preserving context at all times.
Coloration communicates rhythm, tempo, and potential turning points:
• 🔴 = structurally weak effort, i.e. failed moves, fake-outs or trend exhaustion
• 🟡 = neutral volume, as seen in consolidations or pullbacks
• 🟢 = genuine commitment, good for continuation, breakout filters, or early rotation signals
• 🟣 = explosive volume signaling either climax or institutional entry—beware!
Background shading (optional) mirrors these zones across the pane for structural scanning at a glance. Volume bars can be toggled between full-stack mode or clean column view. Every layer is modular—built for composability with tools like ZVOL or OBVX Conviction Bias.
🧐 Ideal Use-Cases:
• 🕰 HTF bias anchoring → LTF execution
• 🧭 Identifying when structure is being driven by real crowd pressure
• 🚫 Fading green/fuchsia bars that fail to break structure
• ✅ Riding green/fuchsia follow-through in directional moves
🍷 Recommended Pairings:
• ZVOL for statistically significant volume anomaly detection
• OBVX Conviction Bias ↔️ for directional confirmation of effort zones
• SUPeR TReND 2.718 for structure-congruent entry filtering
• ATR Turbulence Ribbon to distinguish expansion pressure from churn
🥁 RVOL Effort Matrix is all about seeing—how much pressure is behind a move, whether that pressure is sustainable, and whether the crowd is aligned with price. It's volume, but readable. It’s structure, but dynamic. It’s the difference between obeying noise and trading to the beat of the market.

TrendScope:TrendScope Indicator Description with First-Time User Tutorial
---
Overview:
The TrendScope indicator is designed to give traders a comprehensive view of the market by combining multiple filter sets that analyze different aspects of price action. The filter sets allow you to switch between different views effortlessly and avoid indicator clutter. Whether you're scalping, swing trading, or identifying breakout opportunities, TrendScope helps you make informed decisions by assessing momentum, volatility, trade timing, and trend direction. It also includes a scalp setup you can use to execute trades and manage risk.
---
TrendScope Filter Sets with First-Time User Setup & Tutorial
---
Filter Set A: Short-Term Momentum
Goal:
This filter focuses on the immediate market sentiment without any additional indicators. It reveals where retail traders might enter the market, potentially highlighting areas where they could be stopped out. The goal is to identify these weak spots and anticipate likely price movements that could follow.
No Additional Indicators Required:
This filter set uses moving averages (SMA 20, SMA 50, SMA 100) to determine the short-term trend.
Tutorial:
- To Confirm an Uptrend: Ensure all moving averages are aligned in sequence: SMA 20 above SMA 50, and SMA 50 above SMA 100, all trending upwards.
Action: Consider going long using the scalper in Filter Set D.
- To Confirm a Downtrend: Ensure all moving averages are aligned in sequence: SMA 20 below SMA 50, and SMA 50 below SMA 100, all trending downwards.
Action: Consider going short using the scalper in Filter Set D.
- To Confirm Consolidation: If the moving averages are not aligned or are intertwined, the market is either about to or already trending sideways. The market is in a consolidation phase.
Action: Switch to Filter Set C for further analysis.
---
Filter Set B: Long-Term Momentum
Goal:
Similar to the short-term filter, but with a broader perspective. It helps in understanding the bigger picture, providing insights into longer-term trends and potential reversals for swing trade entries.
No Additional Indicators Required:
This filter set uses moving averages (SMA 20, SMA 100, SMA 200) to determine the long-term trend.
Tutorial:
- To Confirm an Uptrend: Ensure all moving averages are aligned in sequence: SMA 20 above SMA 100, and SMA 100 above SMA 200, all trending upwards.
Action: Consider going long using the scalper in Filter Set D.
- To Confirm a Downtrend: Ensure all moving averages are aligned in sequence: SMA 20 below SMA 100, and SMA 100 below SMA 200, all trending downwards.
Action: Consider going short using the scalper in Filter Set D.
- To Confirm Consolidation: If the moving averages are not aligned or are intertwined, the market is either about to or already trending sideways. The market is in a consolidation phase.
Action: Switch to Filter Set C for further analysis.
---
Filter Set C: Trading Range
This filter uses Bollinger Bands, Volume, and Volume-Weighted Relative Volume Profile (VRVP) to identify trading ranges and predict breakouts and trade timing. In short, when Bollinger Bands contract and volume is below average, the VRVP highlights low-volume areas that can serve as breakout targets, offering a timing edge.
Goal:
Anticipate breakouts in a sideways market.
Additional Indicators Required:
- VRVP: For visualizing volume at specific price levels.
- Volume Indicator: With a 100-period moving average for anticipating low market participation.
Tutorial:
1. Setup Screen: Zoom out to see the entire consolidation phase.
2. Identify Support & Resistance:
- Use VRVP to determine VAH (upper range) and VAL (lower range) support or resistance levels.
- Identify the POC (Point of Control) as the area with the highest support or resistance.
3. Wait for Setup:
- Wait for Bollinger Bands to contract and volume to dip below the average.
- Go short if the price is at VAH, go long if the price is at VAL.
4. Action: Switch to Filter Set D for precise entry, target, and risk management.
---
Filter Set D: Scalper
After determining the market condition using the previous filter sets, you can use this filter set to hunt for trades. Designed for use with Heikin Ashi candles, this filter allows you to enter when there’s high momentum and provides a trailing stop along the way.
Goal:
Execute trades in harmony with the established trend.
Setup Rules:
1. Condition 1: You know the current trend direction as per filter set guidance (A, B, & C), and the trend is up, and you are going long.
2. Condition 2: Wait for the price to close 3 consecutive flat-bottom Heikin Ashi candles above the 7 MA. Then Enter on the open of the fourth Candle.
3. Condition 3: The 3x candles have to be above the 7 MA (red line), and the 7 MA has to be above the 50 EMA (yellow line).
Trade Management:
Use the 50 EMA (Yellow Line) as a trailing stop and hold the position until a candle opens and closes below the 7 SMA (Red Line).
---
Additional Filter Sets
These filter sets are designed to accommodate various trading strategies, allowing for flexibility depending on the trader's approach.
---
Filter Set E: VWAP
When using the VWAP filter, load the On-Balance Volume (OBV) indicator to complement your analysis. This combination can help confirm volume trends and potential price movements.
Tips:
Look for instances where the VWAP aligns with OBV divergences to confirm or negate potential trade setups.
Tutorial:
- Complement with OBV: Look for volume confirmations.
- Usage: Switch the candles to a line chart. Wait for both the line to close above the VWAP and OBV above the Smoothing Line. Then, switch to Filter Set D and hunt for a long entry as per the strategy. Do the opposite for hunting short entries.
---
Filter Set F: Super Trend
This filter is most effective when paired with the Ichimoku Cloud (using custom settings) along with the MACD and ADX indicators.
Goal:
Gauge trend strength, momentum, and support and resistance levels.
Tutorial:
- Load Ichimoku, MACD, and ADX: To gauge trend strength and momentum.
- Usage Tips:
I use the cloud to look for long periods where the clouds print horizontal levels and use them for support and resistance levels. Alternatively, use the ADX. When the price breaks up through the super trend downtrend line and retraces back to the top of the Ichimoku cloud, switch to Filter Set D and hunt for a long scalp entry. For a short entry, wait for the price to break through the Up Trend Line and retrace back up to the cloud. Then, switch to Filter Set D and use the setup to hunt for a short.
---
Filter Set G: Keltner Channels
Combine this filter with Donchian Channels and the Average True Range (ATR) for enhanced volatility analysis. This filter set works similarly to Filter Set C.
Goal:
Measure volatility and predict breakouts.
Tutorial:
- Load Donchian Channels or ATR: To measure volatility and breakouts.
- Usage Tips:
Look for the price to fall through the Keltner lower line and the ATR making a higher low. Then, use the scalper for entries, with Donchian boundaries as take-profit estimates.
---
Filter Set H: Pivot Points
This filter works with the RSI to spot divergences that could signal a trend change or reversal.
Goal:
Identify divergences and trend reversals.
Tutorial:
- Load RSI: For identifying divergences.
- Usage Tips:
Use RSI in conjunction with pivot points to identify divergences. Then, switch to Filter Set D and use the scalper to hunt for swing entries in the divergence direction.
---
Filter Set I: Opening Range Breakout
This filter uses the Seasonality indicator to gauge investor sentiment and prediction sentiment.
Goal:
Assess market sentiment and predict breakout directions.
Tutorial:
- Load Seasonality Indicator: To assess market sentiment.
- Usage Tips:
Use seasonal trends to gauge potential breakout directions. Use on the daily timeframe only. Risk on investment zones are when the price is close to the ORB low level. Realize investment profit when the price is nearing the ORB high level, considering that there has to be divergence as determined using Filter Set H.
---
By following this structured approach, traders can learn to navigate different market conditions, using TrendScope to make informed decisions based on a comprehensive analysis of momentum, trend, and volatility. The goal is to go through all the filter sets and combine them with the scalp setup in Filter Set D, using the additional filters to adapt to various strategies and market conditions.

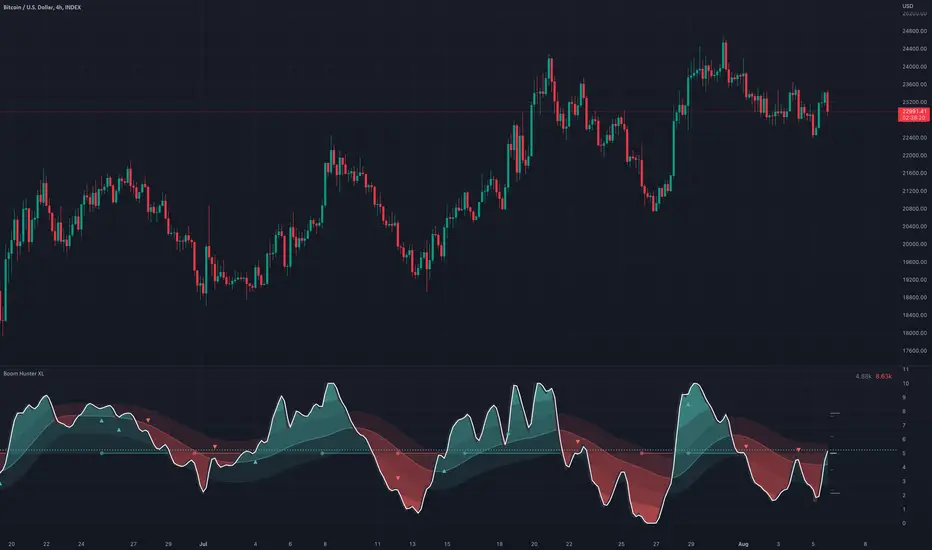
Boom Hunter XLBoom Hunter XL is a professional trading tool designed to expose perfect entries and incredible exits. This complete ground up rebuild of Boom Hunter Pro is an absolute essential for any professional trader or anyone serious about trading. Boom Hunter XL includes many upgrades to the Pro version such as volume pressure analysis, improved pressure dots, two new support and resistance lines and volume breakout detection. It also has options to display current volume and average volume it the top right corner.
A new and improved Volume Pressure Analysis exclusive to Boom Hunter XL can be turned on or off in the settings. This provides relative volume information highlighting anomalies and key movements. It also shows volume pressure. Sometimes when crossing a support or resistance line it takes a lot of volume to move price just a little. When price action crosses or bounces off a SR line it requires very little volume to move the price a lot. What this means is traders can visually see price action getting pulled in or pushed away from a SR line. The current bar shows live directional pressure. Volume pressure is used to confirm entries and continuations.
Red wave is the main support resistance line dictating short term trend direction. Enter trades after the oscillator crosses through or even better with pressure dots or volume pressure. If the oscillator is above the red wave it is an up trend and if it is below its a down trend.
The gray wave shows medium term support/resistance and general trend. This line is much harder to cross. Price action can easily bounce within this wave or get rejected.
The strongest SR lines are the top and bottom gray lines. The resistance line will bottom out under pressure and expose a low point. Likewise the support line will roof and expose a high point.
When there is extreme pressure the gray line will drag. This signal suggests that price action will will pullback and retest and push again. Avoid entering trades in these moments as the true bottom/top has not been exposed. Following price action along longer timeframe charts will help find the true low/high.
Tracking traditional patterns makes it easy to find the next breakout and direction.
Bear patterns
Bull patterns
Volume breakouts
Drawing support and resistance lines
Example of some of the signals:
Wealthy Tech v1.4This script was design to guide the trader in three different ways as a "one stop" place so the trader can have all the basics covered and working together , the indicator is organized by two control panels and one set of technical tools.
1 - First Panel - "Advanced Trading Tools"
- Providing many important parameters that a trader must know before sending an order.
- Displays a green, yellow or red signal in front of the current data helping the trader to quickly identify the overall status of the asset.
- Parameters such as :
Average Daily Range in the past 20 days (ADR)
Current ADR of the day, Live ADR of the current Open/Close
Relative Strength , if in a Bull or Bear Market
Minimum and recommended Dollar Volume to guarantee the necessary liquidity
StochRSI warnings if oversold or bought
Volume /relative volume corresponds to a minimum for a good liquidity
Distance of the current price to the majors moving averages
Also a quick way to have your order size automatically calculated with a stop loss set at either the lows of the day or the last Lower High, giving you an order size and max risk/loss at all times.
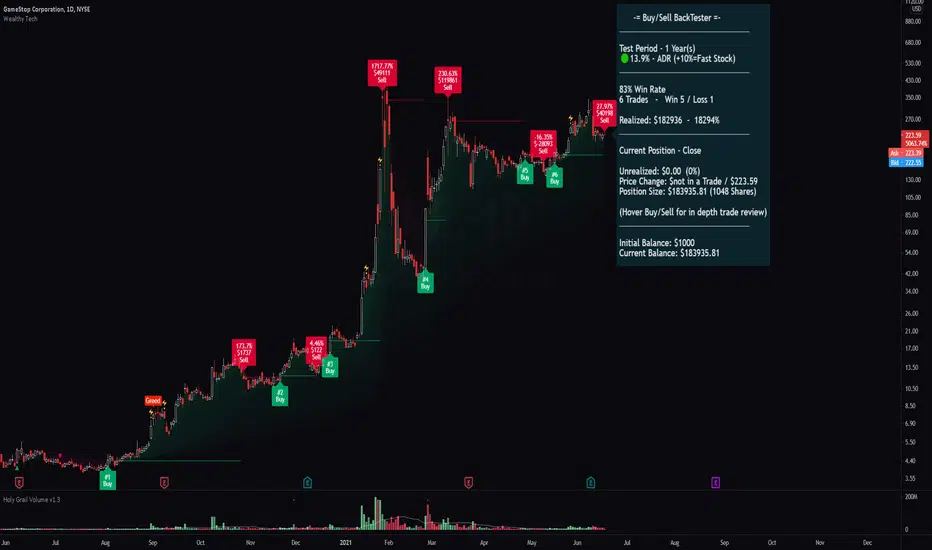
2 - Second Panel - "Buy/Sell Signal tool with live Backtester"
- Buy and Sell signals are provided for the beginner/busy trader. Using a set of combinations to determine the most probable period to enter and exit with adjustability by the user being able to choose how fast or slow the parameters should track the data.
- The live Backtester shows positions and historically calculations of all the Buy/Sell signals during the requested period. Showing how much you would've profit/lose if you had took those trades, helping you to decide which timeframe to use in conjunction to the Buy/Sell speed to give the most profitable probability.
- By hovering on the Buy/Sell, you'll find in depth information about each trade (Trading View limits the number of information the is being showed in a chart. If you have too many trades going back in history, it'll only show the max available)
- Keep in mind that the Buy/Sell signal repaints only while the candle is open. If you don't want to take your chances for a better entry, just wait for the candle to close so you have your confirmation. Over time you'll evolve a sense of all the functionalities and learn how to quickly identify what the indicator is trying to show. It takes a few tries to catch a big move, don't be afraid to be stopped or a low Win rate. What really matter is how much you're realizing by the end of the day. You most probably won't have any success in trade if you aren't able to stop your bad trades.
3 - Technical indicators and Visual Implementations
- Tools such as:
Open Range High/Low showing the first 30 min of the day. One of the best ways to identify and perfect breakout entry point
Improved MAs with auto color change indicating when it is strong or weak
MAs Flow Cloud for a generalized asset visualization of a Bull/Bear Market
Scalp line with variable speed helps you get in and our of a scalp with confidence.
High Volatility Reversals and Fear/Greed shows you the most probable point of a reversal/resistance to happen.
Volume Spike
Higher High / Higher Low / Lower High / Lower Low plots to help you visualize the channels.
The indicator is in BETA version, improvements and fixes will be added constantly.
New ideas and recommendations are welcomed.
Thank you very much for your time
MACD, RSI, & RVOL Strategy
This strategy combines the use of MACD (12, 26, 9), RSI (14, 30, 70), and RVOL (14) to create Long Buy and Sell signals. This works well with many different time intervals but was developed with 15-minute intervals in mind.
Using MACD as a reference, the strategy identifies when the MACD line crosses over (a factor in a buy signal) and under (a factor in a Sell signal) the Signal line. This shows a shift in positive (cross over) and negative (cross under) of a security.
Using the Relative Strength Index ( RSI ) as an indicator, the strategy notices when the velocity and magnitude of the directional price movements cross over the Oversold signal (30) and crosses under the Overbought signal (70) as a factor in creating a Buy and Sell signal.
Using Relative Volume (RVOL) as an indicator, the strategy calculates when the current volume has crossed over the 2x average volume indicator over a given period and is then used as a factor in creating a Buy signal. RVOL is also used when the change in volume crosses under a set RVOL number (in this strategy, it is set to a RVOL of 5).
RVOL = Current Volume / Average Volume over a certain period
This strategy indicates a Buy signal when 2/3 conditions are met:
- RSI Cross Over the Over Sold signal (default 30)
- MACD Cross Over of Signal ( MACD > Signal)
- RVOL Cross Over of 2 (RVOL > 2)
This strategy indicates a Sell signal when 2/3 conditions are met:
- RSI Cross Under the Over Bought signal (default 70)
- MACD Cross Under of Signal ( MACD < Signal)
- RVOL Cross Under 5 (RVOL < 5)
Enjoy and leave feedback!

`security()` revisited [PineCoders]NOTE
The non-repainting technique in this publication that relies on bar states is now deprecated, as we have identified inconsistencies that undermine its credibility as a universal solution. The outputs that use the technique are still available for reference in this publication. However, we do not endorse its usage. See this publication for more information about the current best practices for requesting HTF data and why they work.
█ OVERVIEW
This script presents a new function to help coders use security() in both repainting and non-repainting modes. We revisit this often misunderstood and misused function, and explain its behavior in different contexts, in the hope of dispelling some of the coder lure surrounding it. The function is incredibly powerful, yet misused, it can become a dangerous WMD and an instrument of deception, for both coders and traders.
We will discuss:
• How to use our new `f_security()` function.
• The behavior of Pine code and security() on the three very different types of bars that make up any chart.
• Why what you see on a chart is a simulation, and should be taken with a grain of salt.
• Why we are presenting a new version of a function handling security() calls.
• Other topics of interest to coders using higher timeframe (HTF) data.
█ WARNING
We have tried to deliver a function that is simple to use and will, in non-repainting mode, produce reliable results for both experienced and novice coders. If you are a novice coder, stick to our recommendations to avoid getting into trouble, and DO NOT change our `f_security()` function when using it. Use `false` as the function's last argument and refrain from using your script at smaller timeframes than the chart's. To call our function to fetch a non-repainting value of close from the 1D timeframe, use:
f_security(_sym, _res, _src, _rep) => security(_sym, _res, _src )
previousDayClose = f_security(syminfo.tickerid, "D", close, false)
If that's all you're interested in, you are done.
If you choose to ignore our recommendation and use the function in repainting mode by changing the `false` in there for `true`, we sincerely hope you read the rest of our ramblings before you do so, to understand the consequences of your choice.
Let's now have a look at what security() is showing you. There is a lot to cover, so buckle up! But before we dig in, one last thing.
What is a chart?
A chart is a graphic representation of events that occur in markets. As any representation, it is not reality, but rather a model of reality. As Scott Page eloquently states in The Model Thinker : "All models are wrong; many are useful". Having in mind that both chart bars and plots on our charts are imperfect and incomplete renderings of what actually occurred in realtime markets puts us coders in a place from where we can better understand the nature of, and the causes underlying the inevitable compromises necessary to build the data series our code uses, and print chart bars.
Traders or coders complaining that charts do not reflect reality act like someone who would complain that the word "dog" is not a real dog. Let's recognize that we are dealing with models here, and try to understand them the best we can. Sure, models can be improved; TradingView is constantly improving the quality of the information displayed on charts, but charts nevertheless remain mere translations. Plots of data fetched through security() being modelized renderings of what occurs at higher timeframes, coders will build more useful and reliable tools for both themselves and traders if they endeavor to perfect their understanding of the abstractions they are working with. We hope this publication helps you in this pursuit.
█ FEATURES
This script's "Inputs" tab has four settings:
• Repaint : Determines whether the functions will use their repainting or non-repainting mode.
Note that the setting will not affect the behavior of the yellow plot, as it always repaints.
• Source : The source fetched by the security() calls.
• Timeframe : The timeframe used for the security() calls. If it is lower than the chart's timeframe, a warning appears.
• Show timeframe reminder : Displays a reminder of the timeframe after the last bar.
█ THE CHART
The chart shows two different pieces of information and we want to discuss other topics in this section, so we will be covering:
A — The type of chart bars we are looking at, indicated by the colored band at the top.
B — The plots resulting of calling security() with the close price in different ways.
C — Points of interest on the chart.
A — Chart bars
The colored band at the top shows the three types of bars that any chart on a live market will print. It is critical for coders to understand the important distinctions between each type of bar:
1 — Gray : Historical bars, which are bars that were already closed when the script was run on them.
2 — Red : Elapsed realtime bars, i.e., realtime bars that have run their course and closed.
The state of script calculations showing on those bars is that of the last time they were made, when the realtime bar closed.
3 — Green : The realtime bar. Only the rightmost bar on the chart can be the realtime bar at any given time, and only when the chart's market is active.
Refer to the Pine User Manual's Execution model page for a more detailed explanation of these types of bars.
B — Plots
The chart shows the result of letting our 5sec chart run for a few minutes with the following settings: "Repaint" = "On" (the default is "Off"), "Source" = `close` and "Timeframe" = 1min. The five lines plotted are the following. They have progressively thinner widths:
1 — Yellow : A normal, repainting security() call.
2 — Silver : Our recommended security() function.
3 — Fuchsia : Our recommended way of achieving the same result as our security() function, for cases when the source used is a function returning a tuple.
4 — White : The method we previously recommended in our MTF Selection Framework , which uses two distinct security() calls.
5 — Black : A lame attempt at fooling traders that MUST be avoided.
All lines except the first one in yellow will vary depending on the "Repaint" setting in the script's inputs. The first plot does not change because, contrary to all other plots, it contains no conditional code to adapt to repainting/no-repainting modes; it is a simple security() call showing its default behavior.
C — Points of interest on the chart
Historical bars do not show actual repainting behavior
To appreciate what a repainting security() call will plot in realtime, one must look at the realtime bar and at elapsed realtime bars, the bars where the top line is green or red on the chart at the top of this page. There you can see how the plots go up and down, following the close value of each successive chart bar making up a single bar of the higher timeframe. You would see the same behavior in "Replay" mode. In the realtime bar, the movement of repainting plots will vary with the source you are fetching: open will not move after a new timeframe opens, low and high will change when a new low or high are found, close will follow the last feed update. If you are fetching a value calculated by a function, it may also change on each update.
Now notice how different the plots are on historical bars. There, the plot shows the close of the previously completed timeframe for the whole duration of the current timeframe, until on its last bar the price updates to the current timeframe's close when it is confirmed (if the timeframe's last bar is missing, the plot will only update on the next timeframe's first bar). That last bar is the only one showing where the plot would end if that timeframe's bars had elapsed in realtime. If one doesn't understand this, one cannot properly visualize how his script will calculate in realtime when using repainting. Additionally, as published scripts typically show charts where the script has only run on historical bars, they are, in fact, misleading traders who will naturally assume the script will behave the same way on realtime bars.
Non-repainting plots are more accurate on historical bars
Now consider this chart, where we are using the same settings as on the chart used to publish this script, except that we have turned "Repainting" off this time:
The yellow line here is our reference, repainting line, so although repainting is turned off, it is still repainting, as expected. Because repainting is now off, however, plots on historical bars show the previous timeframe's close until the first bar of a new timeframe, at which point the plot updates. This correctly reflects the behavior of the script in the realtime bar, where because we are offsetting the series by one, we are always showing the previously calculated—and thus confirmed—higher timeframe value. This means that in realtime, we will only get the previous timeframe's values one bar after the timeframe's last bar has elapsed, at the open of the first bar of a new timeframe. Historical and elapsed realtime bars will not actually show this nuance because they reflect the state of calculations made on their close , but we can see the plot update on that bar nonetheless.
► This more accurate representation on historical bars of what will happen in the realtime bar is one of the two key reasons why using non-repainting data is preferable.
The other is that in realtime, your script will be using more reliable data and behave more consistently.
Misleading plots
Valiant attempts by coders to show non-repainting, higher timeframe data updating earlier than on our chart are futile. If updates occur one bar earlier because coders use the repainting version of the function, then so be it, but they must then also accept that their historical bars are not displaying information that is as accurate. Not informing script users of this is to mislead them. Coders should also be aware that if they choose to use repainting data in realtime, they are sacrificing reliability to speed and may be running a strategy that behaves very differently from the one they backtested, thus invalidating their tests.
When, however, coders make what are supposed to be non-repainting plots plot artificially early on historical bars, as in examples "c4" and "c5" of our script, they would want us to believe they have achieved the miracle of time travel. Our understanding of the current state of science dictates that for now, this is impossible. Using such techniques in scripts is plainly misleading, and public scripts using them will be moderated. We are coding trading tools here—not video games. Elementary ethics prescribe that we should not mislead traders, even if it means not being able to show sexy plots. As the great Feynman said: You should not fool the layman when you're talking as a scientist.
You can readily appreciate the fantasy plot of "c4", the thinnest line in black, by comparing its supposedly non-repainting behavior between historical bars and realtime bars. After updating—by miracle—as early as the wide yellow line that is repainting, it suddenly moves in a more realistic place when the script is running in realtime, in synch with our non-repainting lines. The "c5" version does not plot on the chart, but it displays in the Data Window. It is even worse than "c4" in that it also updates magically early on historical bars, but goes on to evaluate like the repainting yellow line in realtime, except one bar late.
Data Window
The Data Window shows the values of the chart's plots, then the values of both the inside and outside offsets used in our calculations, so you can see them change bar by bar. Notice their differences between historical and elapsed realtime bars, and the realtime bar itself. If you do not know about the Data Window, have a look at this essential tool for Pine coders in the Pine User Manual's page on Debugging . The conditional expressions used to calculate the offsets may seem tortuous but their objective is quite simple. When repainting is on, we use this form, so with no offset on all bars:
security(ticker, i_timeframe, i_source )
// which is equivalent to:
security(ticker, i_timeframe, i_source)
When repainting is off, we use two different and inverted offsets on historical bars and the realtime bar:
// Historical bars:
security(ticker, i_timeframe, i_source )
// Realtime bar (and thus, elapsed realtime bars):
security(ticker, i_timeframe, i_source )
The offsets in the first line show how we prevent repainting on historical bars without the need for the `lookahead` parameter. We use the value of the function call on the chart's previous bar. Since values between the repainting and non-repainting versions only differ on the timeframe's last bar, we can use the previous value so that the update only occurs on the timeframe's first bar, as it will in realtime when not repainting.
In the realtime bar, we use the second call, where the offsets are inverted. This is because if we used the first call in realtime, we would be fetching the value of the repainting function on the previous bar, so the close of the last bar. What we want, instead, is the data from the previous, higher timeframe bar , which has elapsed and is confirmed, and thus will not change throughout realtime bars, except on the first constituent chart bar belonging to a new higher timeframe.
After the offsets, the Data Window shows values for the `barstate.*` variables we use in our calculations.
█ NOTES
Why are we revisiting security() ?
For four reasons:
1 — We were seeing coders misuse our `f_secureSecurity()` function presented in How to avoid repainting when using security() .
Some novice coders were modifying the offset used with the history-referencing operator in the function, making it zero instead of one,
which to our horror, caused look-ahead bias when used with `lookahead = barmerge.lookahead_on`.
We wanted to present a safer function which avoids introducing the dreaded "lookahead" in the scripts of unsuspecting coders.
2 — The popularity of security() in screener-type scripts where coders need to use the full 40 calls allowed per script made us want to propose
a solid method of allowing coders to offer a repainting/no-repainting choice to their script users with only one security() call.
3 — We wanted to explain why some alternatives we see circulating are inadequate and produce misleading behavior.
4 — Our previous publication on security() focused on how to avoid repainting, yet many other considerations worthy of attention are not related to repainting.
Handling tuples
When sending function calls that return tuples with security() , our `f_security()` function will not work because Pine does not allow us to use the history-referencing operator with tuple return values. The solution is to integrate the inside offset to your function's arguments, use it to offset the results the function is returning, and then add the outside offset in a reassignment of the tuple variables, after security() returns its values to the script, as we do in our "c2" example.
Does it repaint?
We're pretty sure Wilder was not asked very often if RSI repainted. Why? Because it wasn't in fashion—and largely unnecessary—to ask that sort of question in the 80's. Many traders back then used daily charts only, and indicator values were calculated at the day's close, so everybody knew what they were getting. Additionally, indicator values were calculated by generally reputable outfits or traders themselves, so data was pretty reliable. Today, almost anybody can write a simple indicator, and the programming languages used to write them are complex enough for some coders lacking the caution, know-how or ethics of the best professional coders, to get in over their heads and produce code that does not work the way they think it does.
As we hope to have clearly demonstrated, traders do have legitimate cause to ask if MTF scripts repaint or not when authors do not specify it in their script's description.
► We recommend that authors always use our `f_security()` with `false` as the last argument to avoid repainting when fetching data dependent on OHLCV information. This is the only way to obtain reliable HTF data. If you want to offer users a choice, make non-repainting mode the default, so that if users choose repainting, it will be their responsibility. Non-repainting security() calls are also the only way for scripts to show historical behavior that matches the script's realtime behavior, so you are not misleading traders. Additionally, non-repainting HTF data is the only way that non-repainting alerts can be configured on MTF scripts, as users of MTF scripts cannot prevent their alerts from repainting by simply configuring them to trigger on the bar's close.
Data feeds
A chart at one timeframe is made up of multiple feeds that mesh seamlessly to form one chart. Historical bars can use one feed, and the realtime bar another, which brokers/exchanges can sometimes update retroactively so that elapsed realtime bars will reappear with very slight modifications when the browser's tab is refreshed. Intraday and daily chart prices also very often originate from different feeds supplied by brokers/exchanges. That is why security() calls at higher timeframes may be using a completely different feed than the chart, and explains why the daily high value, for example, can vary between timeframes. Volume information can also vary considerably between intraday and daily feeds in markets like stocks, because more volume information becomes available at the end of day. It is thus expected behavior—and not a bug—to see data variations between timeframes.
Another point to keep in mind concerning feeds it that when you are using a repainting security() plot in realtime, you will sometimes see discrepancies between its plot and the realtime bars. An artefact revealing these inconsistencies can be seen when security() plots sometimes skip a realtime chart bar during periods of high market activity. This occurs because of races between the chart and the security() feeds, which are being monitored by independent, concurrent processes. A blue arrow on the chart indicates such an occurrence. This is another cause of repainting, where realtime bar-building logic can produce different outcomes on one closing price. It is also another argument supporting our recommendation to use non-repainting data.
Alternatives
There is an alternative to using security() in some conditions. If all you need are OHLC prices of a higher timeframe, you can use a technique like the one Duyck demonstrates in his security free MTF example - JD script. It has the great advantage of displaying actual repainting values on historical bars, which mimic the code's behavior in the realtime bar—or at least on elapsed realtime bars, contrary to a repainting security() plot. It has the disadvantage of using the current chart's TF data feed prices, whereas higher timeframe data feeds may contain different and more reliable prices when they are compiled at the end of the day. In its current state, it also does not allow for a repainting/no-repainting choice.
When `lookahead` is useful
When retrieving non-price data, or in special cases, for experiments, it can be useful to use `lookahead`. One example is our Backtesting on Non-Standard Charts: Caution! script where we are fetching prices of standard chart bars from non-standard charts.
Warning users
Normal use of security() dictates that it only be used at timeframes equal to or higher than the chart's. To prevent users from inadvertently using your script in contexts where it will not produce expected behavior, it is good practice to warn them when their chart is on a higher timeframe than the one in the script's "Timeframe" field. Our `f_tfReminderAndErrorCheck()` function in this script does that. It can also print a reminder of the higher timeframe. It uses one security() call.
Intrabar timeframes
security() is not supported by TradingView when used with timeframes lower than the chart's. While it is still possible to use security() at intrabar timeframes, it then behaves differently. If no care is taken to send a function specifically written to handle the successive intrabars, security() will return the value of the last intrabar in the chart's timeframe, so the last 1H bar in the current 1D bar, if called at "60" from a "D" chart timeframe. If you are an advanced coder, see our FAQ entry on the techniques involved in processing intrabar timeframes. Using intrabar timeframes comes with important limitations, which you must understand and explain to traders if you choose to make scripts using the technique available to others. Special care should also be taken to thoroughly test this type of script. Novice coders should refrain from getting involved in this.
█ TERMINOLOGY
Timeframe
Timeframe , interval and resolution are all being used to name the concept of timeframe. We have, in the past, used "timeframe" and "resolution" more or less interchangeably. Recently, members from the Pine and PineCoders team have decided to settle on "timeframe", so from hereon we will be sticking to that term.
Multi-timeframe (MTF)
Some coders use "multi-timeframe" or "MTF" to name what are in fact "multi-period" calculations, as when they use MAs of progressively longer periods. We consider that a misleading use of "multi-timeframe", which should be reserved for code using calculations actually made from another timeframe's context and using security() , safe for scripts like Duyck's one mentioned earlier, or TradingView's Relative Volume at Time , which use a user-selected timeframe as an anchor to reset calculations. Calculations made at the chart's timeframe by varying the period of MAs or other rolling window calculations should be called "multi-period", and "MTF-anchored" could be used for scripts that reset calculations on timeframe boundaries.
Colophon
Our script was written using the PineCoders Coding Conventions for Pine .
The description was formatted using the techniques explained in the How We Write and Format Script Descriptions PineCoders publication.
Snippets were lifted from our MTF Selection Framework , then massaged to create the `f_tfReminderAndErrorCheck()` function.
█ THANKS
Thanks to apozdnyakov for his help with the innards of security() .
Thanks to bmistiaen for proofreading our description.
Look first. Then leap.

RVG Sniper v1.1Indicator based on: Facon Talon Sniper v1 and Market Cipher B Free version from falconCoin, however this one uses both MA and relative volume for confirmation of buy and sell entries.

Sim ScoreIntroduction: The Sim Score is a performance metric similar to the Sharpe Ratio in that it characterizes risk-adjusted returns. What differentiates the Sim Score from the Sharpe Ratio is that the formula has a component that calibrates the score based on relative volume.
Description: Scores generally take on a value between -4 and 4. Scores are provided for XBTUSD and a basket of alt/BTC pairs including ( )/BTC. The scores together can provide insight into the relation between alt/BTC pairs and XBTUSD. When alt/BTC scores are relatively similar (“bunching”), these pairs are considered to be highly correlated. Using any preferred method to determine trend, when bunching occurs, it is recommended to take alt/BTC positions all in the same direction. When all scores are falling, this would suggest that players are exiting crypto markets to fiat. Other useful information about the Sim Score is provided below:
Reliable divergences: While a popular signal to help inform trades, divergences alone are not reliable, and even when used to provide confirmation, they are quickly invalidated in trending markets. Sim Score divergences, on the other hand, have more predictive power of trend exhaustion.
Directional bias: When a value > 4 or < -4 prints for the XBT score, circles are plotted which is a strong indication that the trend is moving in that direction. A word of caution — note where the alt/BTC scores are relative to XBTUSD score. If they are bunched together (moving in unison suggesting significant correlation between alt/BTC pairs) and have values inversely proportional to the XBT score, the chance of a countertrend move increases.
Effective on low timeframes: Provided below are a few setups that can be employed.
Divergences: Effective on all timeframes.
Countertrend setups: Requires bunching of alt/BTC scores that have values inversely proportional to the XBT score.
Zero-value cross events: Requires bunching of alt/BTC scores and an XBT-alt/BTC crossover event at the midline (zero-value).
Midline retest: For a bullish retest, requires alt/BTC scores to be negative and the XBT score to be positive. Both plots approach the midline and are rejected signaling continuation.
The utility in the Sim Score extends beyond the primer and examples above. A deeper look into the edge it can provide is available to subscribers. If interested in adding it to your trading toolkit, lifetime permissions for the Sim Score can be purchased for a modest fee of .015 BTC. As always, feel free to send me a DM with any questions you have about the Sim Score. Thank you for your interest in my work.
Happy trades,
Sim


Silent Trigger Silent Trigger combines widely used concepts under one scoring engine. Each module adds weight only when its conditions are met:
1. Higher-Timeframe (HTF) context
• Requests 1H and the next HTF up (e.g., 4H/D) with request.security(...) on confirmed bars only.
• Uses RSI(14) and a MACD line (EMA12–EMA26 difference) for bias.
• By default HTF weights the score. There is an option to require HTF alignment if you prefer a hard filter.
2. Market regime
• ADX for trend strength.
• Bollinger Band width and a fractal-energy proxy to detect squeeze/coiling vs expansion.
3. Smart-money / Wyckoff structure
• High-volume narrow bars, absorption, spring/upthrust, and liquidity grabs past recent swing highs/lows.
4. Momentum & divergences
• RSI and MACD-line divergences (regular + hidden) and simple exhaustion checks.
5. Fair Value Gaps (FVG)
• 3-bar gap with mid-gap revisit confirmation.
6. Volume context
• Relative volume and a compact 10-bin rolling volume profile to locate HVN proximity.
7. Sessions / time filter
• Optional London/NY “kill zone” participation filter.
8. Correlation (optional)
• Simple BTC trend check for USD-quoted markets.
Pre-Move (yellow) logic:
Triggers only when the market is compressed (squeeze/low fractal energy), ADX is rising, the MACD histogram is near zero (pressure building), and there is a money-flow impulse (MFI slope and/or OBV Z-score spike).
The yellow diamond is plotted on the side of the expected move:
• Below for bullish reversals / Above for bullish breakouts.
• Above for bearish reversals / Below for bearish breakouts.
A built-in cooldown keeps yellows from spamming.
⸻
What appears on the chart
• Bull diamond (green): Total score ≥ your threshold and > bear score.
• Bear diamond (magenta): Mirror of the above.
• Pre-move (yellow): Early heads-up; use it with HTF context and structure.
All diamonds are intentionally tiny to minimize clutter.
⸻
Key settings
• Signal Mode & Min Probability – tighten/loosen confirmations.
• Use Higher TF in Scoring – soft weighting (default).
• Require HTF Alignment – optional hard gate.
• Module toggles – Smart Money, Wyckoff, FVG, Correlation, Sessions.
• Pre-Move – enable, cooldown bars, MFI levels, OBV Z-score threshold.
⸻
How to use (practical)
1. Choose a TF that matches your style (5–15m intraday, 1H–4H swing).
2. Read HTF bias first; trade in that direction unless structure clearly supports a reversal.
3. Treat yellow as “get ready.” Act only when a green/magenta prints with structure (S/R, FVG, HVN) and acceptable risk.
4. Place stops beyond the liquidity level or FVG midpoint; size positions conservatively.
⸻
Repainting & HTF policy
• No lookahead is used anywhere.
• request.security is called on confirmed bars; the HTF MACD line is computed inside the HTF context (single series), not by indexing a tuple.
• Signals are designed for bar-close confirmation. Intra-bar alerts can change until the bar closes.
⸻
Limitations (honest)
• Money-flow features depend on volume quality; thin/synthetic volume reduces reliability.
• Pre-moves can fail during unscheduled news shocks or when HTF trend is dominant.
• This is not financial advice. You are responsible for entries, exits, and risk.
⸻
Alerts
Built-in bull/bear alerts include direction and a probability bucket (Basic/Moderate/Strong/Extreme).
Pre-move yellows are primarily visual; you can still set an alert on their plot condition if desired.
⸻
Why this isn’t a “mashup”
• A single probability engine blends HTF bias, structure (liquidity/Wyckoff/FVG), regime, and volume into a score, rather than stacking unrelated indicators.
• A pre-move detector that requires compression + rising trend energy + money-flow impulse, and places the marker on the side of the expected move, with cooldown control.
• A lightweight rolling HVN check to bias continuation vs mean-reversion near key nodes.
⸻
Changelog (summary)
• Current release: pre-move module, HTF hard-gate option, tiny diamonds, clarified HTF/no-repaint policy, session filter tidy-up.

CandelaCharts - Vertex Oscillator 📝 Overview
The Vertex Oscillator is a proprietary momentum-based oscillator designed to detect periods of deep undervaluation (accumulation) and excessive euphoria (distribution) in markets.
By combining price deviation, volume normalization, and volatility scaling, the indicator identifies extreme conditions and provides actionable signals for both traders and analysts.
📦 Features
Volume-normalized momentum – integrates price deviations with relative volume weighting.
Adaptive volatility scaling – reduces distortion from sudden spikes and low-volume noise.
Z-score normalization – standardizes readings into intuitive zones.
Accumulation & Euphoria detection – highlights market extremes with color-coded zones.
Built-in alerts – instantly notify traders when critical thresholds are crossed.
⚙️ Settings
Source: The input price source.
Lookback: Number of bars used for deviation & volatility calculation.
Smoothing: Smoothing length applied to oscillator.
Colors: Customize bullish, bearish, and neutral oscillator line colors.
Zones: Set shading colors for accumulation (≤ -2) and euphoria (≥ +2).
Line: Choose oscillator line width and color.
⚡️ Showcase
≤ -2 (Green Zone)
Market undervaluation / accumulation opportunities.
≥ +2 (Red Zone)
Market euphoria / overheated conditions.
0 (Neutral Line)
Balanced state.
Divergences
📒 Usage
The Vertex Oscillator is most effective when interpreted through its key zones, helping traders quickly spot undervaluation, euphoria, or neutral market conditions.
Identify Accumulation – When the oscillator drops below -2, markets may be undervalued.
Spot Euphoria – When the oscillator rises above +2, markets may be overheated.
Neutral Zone – Around 0, conditions are balanced with no strong bias.
Best Practice – Use alongside trend, support/resistance, or volume tools to confirm signals.
🚨 Alerts
The Vertex Oscillator includes built-in alerts to help traders react instantly when the market enters extreme conditions. Instead of constantly monitoring the chart, alerts notify you in real time when accumulation or euphoria thresholds are triggered.
Deep Accumulation – triggers when the oscillator crosses below -2, signaling undervaluation.
Euphoria Triggered – triggers when the oscillator crosses above +2, signaling overheated conditions.
⚠️ Disclaimer
These tools are exclusively available on the TradingView platform.
Our charting tools are intended solely for informational and educational purposes and should not be regarded as financial, investment, or trading advice. They are not designed to predict market movements or offer specific recommendations. Users should be aware that past performance is not indicative of future results and should not rely on these tools for financial decisions. By using these charting tools, the purchaser agrees that the seller and creator hold no responsibility for any decisions made based on information provided by the tools. The purchaser assumes full responsibility and liability for any actions taken and their consequences, including potential financial losses or investment outcomes that may result from the use of these products.
By purchasing, the customer acknowledges and accepts that neither the seller nor the creator is liable for any undesired outcomes stemming from the development, sale, or use of these products. Additionally, the purchaser agrees to indemnify the seller from any liability. If invited through the Friends and Family Program, the purchaser understands that any provided discount code applies only to the initial purchase of Candela's subscription. The purchaser is responsible for canceling or requesting cancellation of their subscription if they choose not to continue at the full retail price. In the event the purchaser no longer wishes to use the products, they must unsubscribe from the membership service, if applicable.
We do not offer reimbursements, refunds, or chargebacks. Once these Terms are accepted at the time of purchase, no reimbursements, refunds, or chargebacks will be issued under any circumstances.
By continuing to use these charting tools, the user confirms their understanding and acceptance of these Terms as outlined in this disclaimer.

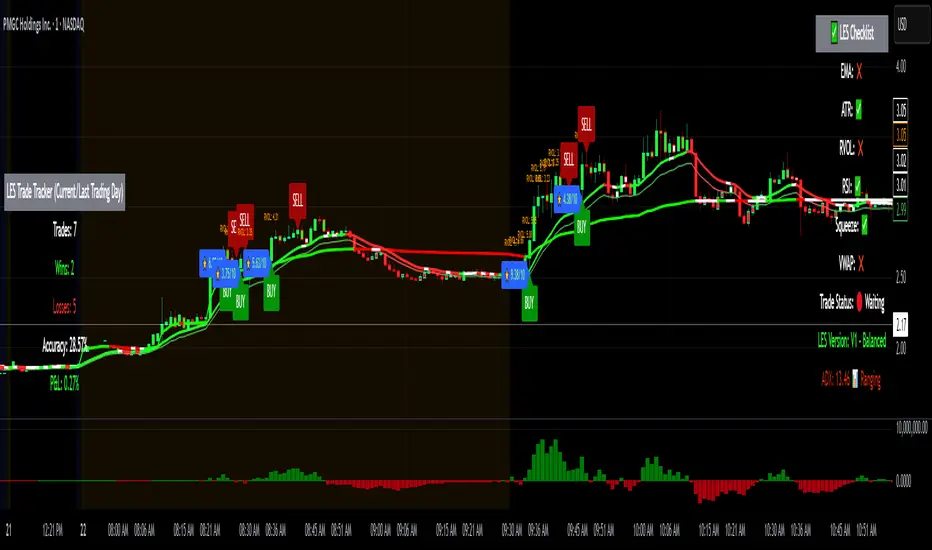
Long Elite Squeeze (LES) — H.H 22 Lindsay (AI)LES (Long Elite Squeeze)
LES (Long Elite Squeeze) is a trading framework designed to capture the highest-probability long setups. It’s not just another signal script — it’s a structured system built to filter noise, manage risk, and keep you aligned with real momentum.
🔹 Core Logic
Breakout Confirmation – Ensures moves have structure, not just random spikes.
Relative Volume (RVOL) – Confirms participation and fuel behind the move.
RSI Alignment – Avoids overextended traps and fakeouts.
Squeeze Momentum – The backbone of LES. Signals fire only after a defined squeeze pattern shift (6+ dark green bars followed by a light green bar).
🔹 Trade Management Built In
Automated Sell Signals – Trigger on either:
2 consecutive dark green bars on Squeeze Momentum
WaveTrend cross down
(only valid after a Buy signal — no random shorts)
HUD Entry Checklist – Live conditions shown on chart.
Status Tracker HUD – Flips between “Waiting for Entry” and “In Trade” for clear context.
🔹 Flexibility
3 switchable squeeze versions (V1, V2, V3) for different market conditions.
Customizable EMA & ATR settings (with color options).
Session-aware logic — filter signals to prime trading hours.
🔹 Blueprint & Credits
LES is a fusion of proven concepts, standing on the shoulders of respected creators:
-Squeeze Momentum – LazyBear
-WaveTrend Oscillator – LazyBear
-Relative Volume – LonesomeTheBlue
Breakout/structural logic – refined from classic frameworks
Their work laid the foundation — LES expands and integrates them into a complete trading system.
⚡ Why LES Stands Out
LES wasn’t coded overnight. It’s the result of countless hours of live testing, rebuilding, and refining. Every feature earned its place by proving value in real trading, not theory.
LES is more than an indicator. It’s a disciplined framework — crafted to turn chaos into structure, randomness into probability, and noise into clarity.
⚠️ Disclaimer: This is a trading framework, not financial advice. Performance depends on trader discipline, risk management, and market conditions.
ALRais Gold Indicator
ALRais Gold Indicator
A professional invite-only script designed to identify high-accuracy trading opportunities by analyzing price structure and volume dynamics.
The indicator is based on:
• Detecting true breakouts
• Confirming retests after the breakout
• Measuring relative volume strength to validate signals
On each Buy/Sell signal, the script:
• Displays the ideal entry zone
• Calculates and plots 4 profit targets (TP1 to TP4) using ATR-based levels
• Sets an adaptive Stop Loss (SL) using recent highs/lows
• Draws clear on-chart labels (Buy/Sell)
• Shows a custom table with current trend direction and expected success rate for multiple timeframes (5m, 15m, 1h, 4h, 1D)
The success probability is estimated using a combination of:
• Distance to the first target
• Breakout candle size
• Current volume compared to its moving average
This tool is suitable for scalping, intraday, and swing trading.
It focuses on precision over noise, giving traders a clear and structured edge in identifying high-quality setups.

Alt Szn Oracle - Institutional GradeThe Alt Szn Oracle is a macro-level indicator built to help traders front-run altseason by tracking liquidity, dominance rotation, sentiment, and capital flows—all in one signal. It’s designed for those who don’t just chase pumps, but want to understand when the tide is turning and why. This tool doesn't predict specific coin breakouts—it tells you when the market as a whole is gearing up to rotate into higher beta assets like altcoins, including memes and microcaps.
The index consolidates ten macro inputs into a normalized, smoothed score from 0–100. These include Bitcoin and Ethereum dominance, ETH/BTC, altcoin market cap (Total3), relative volume flows, and stablecoin supply (USDT, USDC, DAI)—which act as proxies for risk-on appetite and dry powder entering the system. It also incorporates manually updated sentiment metrics from Google Trends and the Fear & Greed Index, giving it a behavioral edge that most indicators lack.
The logic is simple but powerful: when BTC dominance is falling, ETH/BTC is rising, altcoin volume increases relative to BTC/ETH, and stablecoins start moving—you're likely in the early innings of rotation. The index is also filtered through a volatility threshold and smoothed with an EMA to eliminate chop and fakeouts.
Use this indicator on macro charts like TOTAL3, TOTAL2, or ETHBTC to gauge market health, or overlay it on specific coins like PEPE, DOGE, or SOL to confirm if the tide is in your favor. Interpreting the score is straightforward: readings above 80 suggest euphoria and signal it’s time to de-risk, 60–80 indicates expansion and confirms altseason is underway, 40–60 is neutral, and 20–40 is a capitulation zone where smart money accumulates.
What sets this apart is that it doesn’t just track price—it reflects the flow of capital, the positioning of liquidity, and the sentiment of the crowd. Most altseason indicators are lagging, overfitted, or too simplistic. This one is modular, forward-looking, and grounded in real capital rotation theory.
If you're a trader who wants to time the cycle, not guess it, this is your tool. Refine it, fork it, or expand it to your niche—DeFi, NFTs, meme coins, or L1s. It’s a framework for reading the macro winds, not a signal service. Use it with discipline, and you’ll catch the wave while others drown in noise.

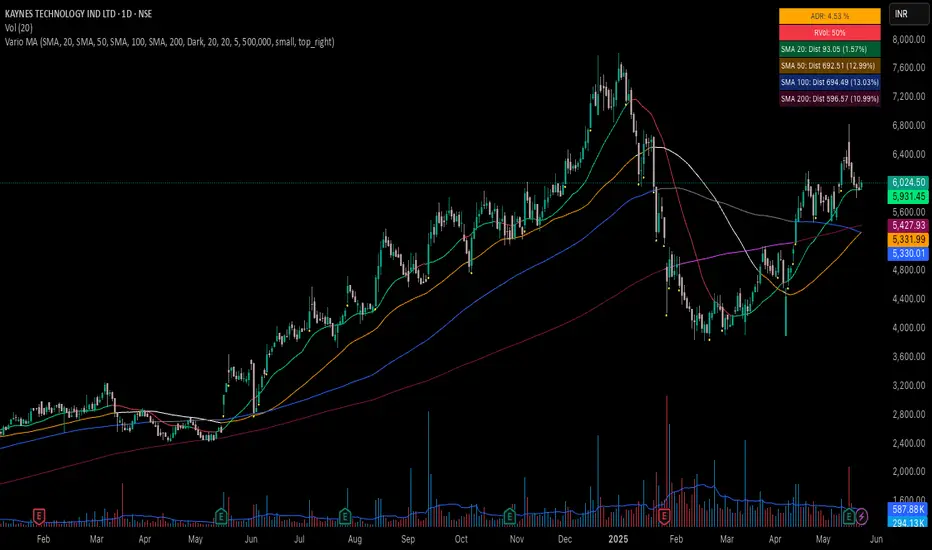
Color Vario Moving Average RibbonColor Vario Moving Average Ribbon – Smart Trend & Momentum Tool for Traders
The Color Vario Moving Average Ribbon is a powerful and customizable indicator that combines trend analysis, momentum detection, and volume confirmation — all in one clean and intuitive design.
🔍 Key Features:
✅ Dynamic Moving Averages (Up to 4)
• Choose from SMA, EMA, WMA, VWMA, or SMMA.
• Each MA line changes color based on price position (above = bullish, below = bearish).
• Great for spotting trend direction and momentum shifts at a glance.
📏 Distance from MAs (Table Display)
• Real-time display of how far price is from each MA (in % and points).
• Helps you assess extension, pullback depth, or reversion potential quickly.
📈 ADR% (Average Daily Range)
• Calculates average volatility using high-low ranges.
• Useful for setting realistic targets, stops, and risk assessments.
🔊 RVol (Relative Volume)
• Compares current volume to the average of recent days.
• Highlights whether volume is above or below normal (green = strong, red = weak).
• Perfect for volume confirmation during entries or breakouts.
⚡ Yellow Dot Signal (Momentum Spike)
• Appears when:
• Price moves more than a custom % from the previous candle.
• Volume is higher than your defined minimum.
• A visual cue for strong price + volume moves, helping you catch momentum trades early.
🎨 UI Customization
• Light/Dark mode compatibility.
• Adjust table size and position for your layout preference.
⸻
🚀 Who Should Use This?
This indicator is ideal for:
• Swing Traders looking for clean trend signals
• Intraday Traders who rely on momentum and volume
• Positional Traders tracking price behavior around key MAs
⸻
📌 Final Words
The Color Vario MA Ribbon is more than just a ribbon — it’s a compact trend, momentum, and volume dashboard built for traders who need clarity and precision.
Whether you’re looking for cleaner entries, stronger confirmations, or smarter exits, this tool adds serious edge to your trading chart.
💬 Don’t forget to give your feedback in the comments!
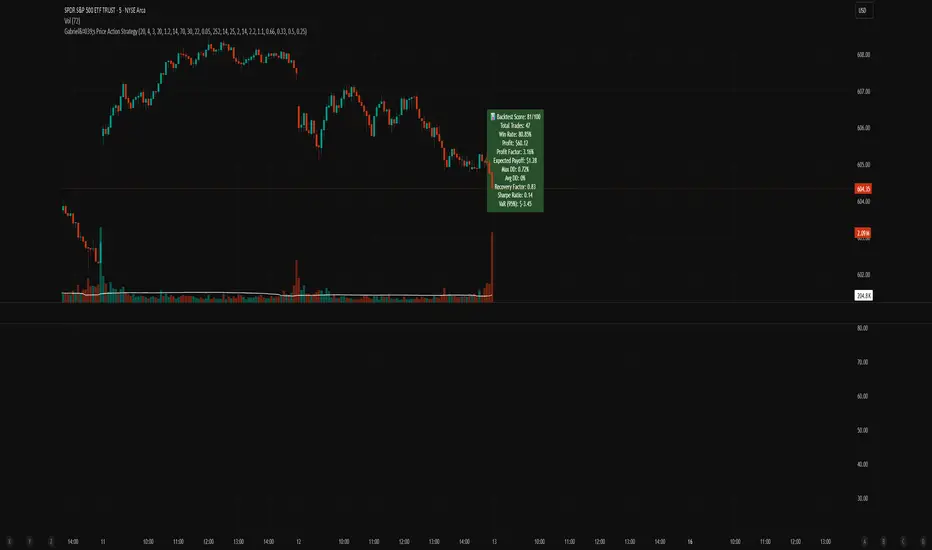
Gabriel's Price Action Strategy🧠 Gabriel's Price Action Strategy — Smart Signal Sequence with Dynamic Risk Control
Created by: OneWallStreetQuant
Strategy Type: Momentum-based Sequence Logic + Smart Volume & RSI Filters
Ideal For: Intraday scalping, swing trading, and momentum trend entries on stocks, forex, crypto, indices.
🚀 Overview
Gabriel's Price Action Strategy is a multi-layered, logic-driven trading system that combines:
✅ Candle Sequence Detection: Detects persistent bullish/bearish momentum using a smart configurable sequence of green/red candles.
✅ Structure Break Filtering: Prevents entries if recent price invalidates the momentum setup (e.g., a red candle breaks a bullish low).
✅ Custom Volume Engine: Integrates a hybrid tick-volume model using Negative/Positive Volume Index (NVI-PVI) to identify smart money flows.
✅ Advanced RSI Logic: Uses Jurik RSX for accurate oversold/overbought filtering.
✅ Optional MTF Trend Filter: Validates trend direction using a slope-based Jurik MA on higher timeframes.
✅ MPT-Based DMI Filter: Adds pyramid entries only during strong trend phases, based on Gain/Pain ratios and Ulcer-index smoothed ADX.
✅ Risk Management: ATR-based SL/TP and fully customizable trailing logic for both profit and stop-loss.
📈 Entry Logic
Trades are triggered only when:
A minimum number of recent candles are bullish/bearish (Min Green/Red Candles)
Structure has not been broken by opposite price action (optional)
Relative volume exceeds average (optional)
RSI is below overbought or above oversold (optional)
MTF slope is aligned with trend direction (optional)
💡 Key Features
Custom Candle Logic: Detects momentum shifts using a tunable lookback window (up to 50 bars).
Smart Volume Filtering: Volume is intelligently estimated using tick-based ranges and NVI-PVI deltas.
Risk Management Built-in: Set your ATR length, SL/TP multipliers, and dynamic trailing offsets with full control.
Scorecard System: A built-in scoring engine evaluates Win Rate, Drawdown, Sharpe Ratio, Recovery Factor, and Profit Factor — visualized on chart as a label.
Backtest-Friendly: Includes date range toggles, bar-magnifier support, and optimized execution on every tick.
📊 Strategy Scorecard (Label)
Automatically calculates:
✅ Total Trades
✅ Win Rate (%)
✅ Net Profit
✅ Profit Factor
✅ Expected Payoff
✅ Max & Avg Drawdown
✅ Recovery Factor
✅ Sharpe Ratio
✅ VaR (95%)
Plus, assigns a normalized score from 0 to 100 for evaluating overall robustness.
⚙️ Customization
Every module — from entry filters to pyramiding and trailing logic — is fully configurable:
Volume Filters ✅
RSI Filters ✅
Structure Break Checks ✅
HTF Jurik MA & Slope Threshold ✅
Multi-Timeframe Mode ✅
Backtest Score Visualization ✅
⚠️ Notes
Enable bar magnifier and calc on every tick for best accuracy.
On early bars, signal logic may delay until enough candles are available.
Best paired with assets showing directional volatility (SPY, BTC, ETH, Gold, etc.).
Ideally paired on trending timeframes such as M1, M5, M15, M30, 1HR, 4 Hourly, Daily, Weekly, Monthly, etc.
Hull Moving Average Adaptive RSI (Ehlers)Hull Moving Average Adaptive RSI (Ehlers)
The Hull Moving Average Adaptive RSI (Ehlers) is an enhanced trend-following indicator designed to provide a smooth and responsive view of price movement while incorporating an additional momentum-based analysis using the Adaptive RSI.
Principle and Advantages of the Hull Moving Average:
- The Hull Moving Average (HMA) is known for its ability to track price action with minimal lag while maintaining a smooth curve.
- Unlike traditional moving averages, the HMA significantly reduces noise and responds faster to market trends, making it highly effective for detecting trend direction and changes.
- It achieves this by applying a weighted moving average calculation that emphasizes recent price movements while smoothing out fluctuations.
Why the Adaptive RSI Was Added:
- The core HMA line remains the foundation of the indicator, but an additional analysis using the Adaptive RSI has been integrated to provide more meaningful insights into momentum shifts.
- The Adaptive RSI is a modified version of the traditional Relative Strength Index that dynamically adjusts its sensitivity based on market volatility.
- By incorporating the Adaptive RSI, the HMA visually represents whether momentum is strengthening or weakening, offering a complementary layer of analysis.
How the Adaptive RSI Influences the Indicator:
- High Adaptive RSI (above 65): The market may be overbought, or bullish momentum could be fading. The HMA turns shades of red, signaling a possible exhaustion phase or potential reversals.
- Neutral Adaptive RSI (around 50): The market is in a balanced state, meaning neither buyers nor sellers are in clear control. The HMA takes on grayish tones to indicate this consolidation.
- Low Adaptive RSI (below 35): The market may be oversold, or bearish momentum could be weakening. The HMA shifts to shades of blue, highlighting potential recovery zones or trend slowdowns.
Why This Combination is Powerful:
- While the HMA excels in tracking trends and reducing lag, it does not provide information about momentum strength on its own.
- The Adaptive RSI bridges this gap by adding a clear visual layer that helps traders assess whether a trend is likely to continue, consolidate, or reverse.
- This makes the indicator particularly useful for spotting trend exhaustion and confirming momentum shifts in real-time.
Best Use Cases:
- Works effectively on timeframes from 1 hour (1H) to 1 day (1D), making it suitable for swing trading and position trading.
- Particularly useful for trading indices (SPY), stocks, forex, and cryptocurrencies, where momentum shifts are frequent.
- Helps identify not just trend direction but also whether that trend is gaining or losing strength.
Recommended Complementary Indicators:
- Adaptive Trend Finder: Helps identify the dominant long-term trend.
- Williams Fractals Ultimate: Provides key reversal points to validate trend shifts.
- RVOL (Relative Volume): Confirms significant moves based on volume strength.
This enhanced HMA with Adaptive RSI provides a powerful, intuitive visual tool that makes trend analysis and momentum interpretation more effective and efficient.
This indicator is for educational and informational purposes only. It should not be considered financial advice or a guarantee of performance. Always conduct your own research and use proper risk management when trading. Past performance does not guarantee future results.

Supertrend pro+ (Adaptive ATR) Supertrend Pro+ (Adaptive ATR) - Param Approach
By SKP
Overview
This advanced Supertrend Pro+ strategy improves on the classic Supertrend indicator by integrating an Adaptive ATR, ensuring dynamic volatility adjustments for more accurate trend detection. This strategy filters out false signals using ADX trend strength validation and volume confirmation, making it a powerful tool for trend-following traders.
Key Features
✔ Adaptive ATR Calculation - Dynamically adjusts to market volatility for more reliable Supertrend signals.
✔ ADX Trend Filter - Ensures trades occur only in strong trending markets, avoiding false breakouts.
✔ Volume Confirmation - Prevents trading in low-liquidity conditions by verifying volume strength.
✔ Multi-Timeframe Analysis - Displays Supertrend trends from different timeframes for enhanced trade confidence.
✔ Trailing Stop & Take Profit Options - Allows flexible risk management with stop-loss and profit-targeting mechanisms.
✔ Custom Alerts for Trade Signals - Alerts trigger on confirmed Supertrend buy/sell signals and potential trend shifts.
✔ Max Drawdown Protection - Automatically closes trades if equity drops beyond a set percentage, preventing excessive losses.
How It Works
Adaptive ATR Calculation
Instead of using a fixed ATR, this strategy calculates an adaptive ATR based on a longer-term ATR baseline.
If volatility increases, the ATR expands dynamically, ensuring stop-losses and Supertrend calculations adjust accordingly.
Supertrend Confirmation
Uses an enhanced Supertrend algorithm with adaptive ATR to determine trend direction.
If price crosses above the trendline, it signals a bullish reversal (Buy Signal).
If price crosses below the trendline, it signals a bearish reversal (Sell Signal).
ADX Trend Strength Filter
Trades are only taken when ADX is above the threshold, ensuring entry in strong trending markets.
Volume Confirmation
Uses a relative volume filter to ensure sufficient liquidity before entering trades.
Helps avoid false breakouts in low-volume conditions.
Risk Management
Trailing Stop Loss - Automatically moves the stop as price moves in favor of the trade.
Manual Stop Loss & Take Profit - Allows precise percentage-based exit points.
Max Drawdown Protection - Closes all trades if equity falls below a set threshold, reducing risk.
Multi-Timeframe Supertrend Table
Displays Supertrend signals across different timeframes (1 min, 5 min, 15 min, 1 hour, Daily)
Helps traders align their entries with higher timeframe trends for better accuracy.
Custom Alerts
Alerts notify when a new buy/sell signal appears.
Extra early warning alerts indicate potential trade setups before confirmation.
How to Use
📌 For trend-following traders:
Focus on entries in the direction of the higher timeframes.
Only enter when ADX is trending and volume confirms liquidity.
📌 For scalpers:
Use shorter timeframes (1m, 5m, 15m) for quick trades.
Adjust the ATR multiplier and Adaptive ATR sensitivity for tighter stops.
📌 For swing traders:
Use longer timeframes (1H, Daily) for more stable trends.
Enable trailing stop loss to lock in profits as the trend progresses.
Inputs & Customization
ATR Period & Adaptive ATR Sensitivity
Supertrend Multiplier
ADX Filter & Threshold
Volume Confirmation Settings
Stop Loss & Take Profit Options
Multi-Timeframe Supertrend Display
Custom Alerts
